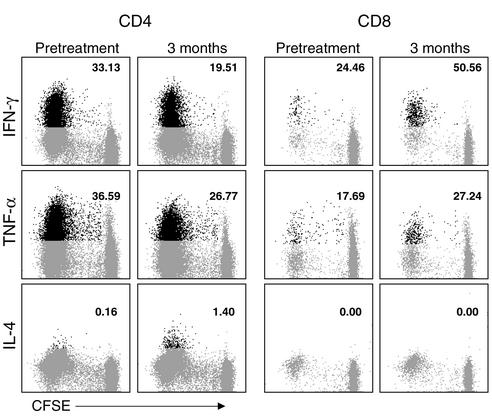
Figure 5.
Intracellular cytokine staining of GA-specific CD4+ and CD8+ T cells. PBMCs were obtained from patient no. MS3 before treatment and at 3 months after the initiation of GA therapy. The cells were stained with CFSE and cultured in the presence of GA. On day 7 of culture, the cells were restimulated for 4 hours with PMA and ionomycin in the presence of brefeldin A and then stained for surface CD4 and CD8 and intracellular cytokine (IFN-γ, TNF-α, or IL-4), as indicated. The data are gated for either CD4+ (left six panels) or CD8+ T cells (right six panels) and show CFSE staining on the x axis and cytokine staining on the y axis. The cutoff was based on staining with isotypic control antibodies. The population in black represents the cytokine-producing, GA-specific cells (i.e., cells within the proliferating fraction). The number indicates the percentage of the GA-specific (proliferating) cells that were positive for the indicated cytokines. As individual cytokine staining was performed in different tubes, it is not possible to assess whether the same or distinct subsets of cells produced the different cytokines.

