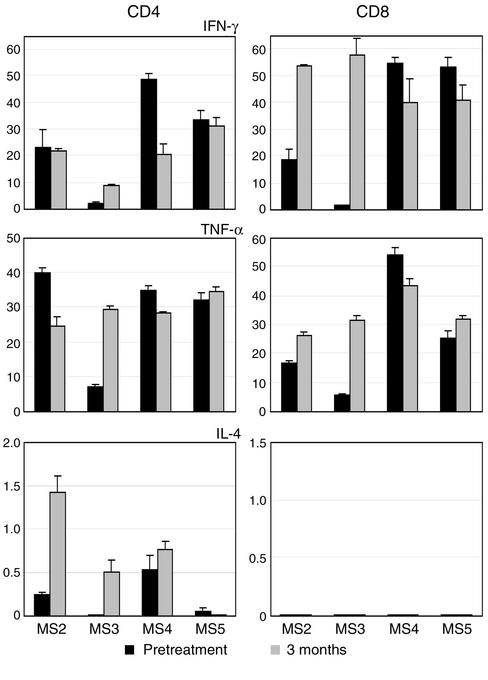
Figure 6.
Cytokine profiles of GA-specific CD4+ and CD8+ T cells. As described in Figure 5, cytokine flow cytometry was conducted on GA-specific cells from the indicated patients. The data from gated CD4+ (left panels) and CD8+ (right panels) T cells are plotted as percent positive cells (+ SEM) on the y axis and represent the proportion of gated, GA-responsive cells that produced the indicated cytokine (duplicate cultures).

