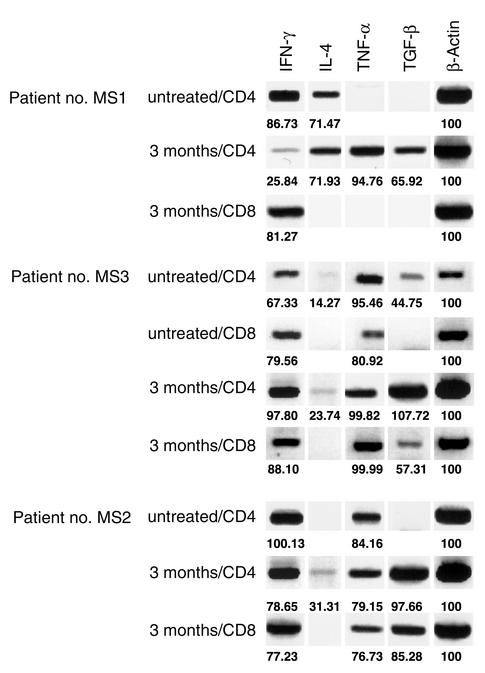
Figure 7.
Functional profile of GA-specific CD4+ and CD8+ T cells. Nonquantitative RT-PCR analyses were performed on the indicated flow-sorted GA-specific CD4+ and CD8+ T cells for qualitative detection of IFN-γ, IL-4, TNF-α, and TGF-β. These assays were performed on PBMCs from three patients before treatment and at 3 months after the initiation of GA therapy. Patients no. MS1 and no. MS2 did not yield adequate GA-reactive CD8+ cells before treatment (no β-actin bands observed). The numbers indicate band density values normalized to β-actin.

