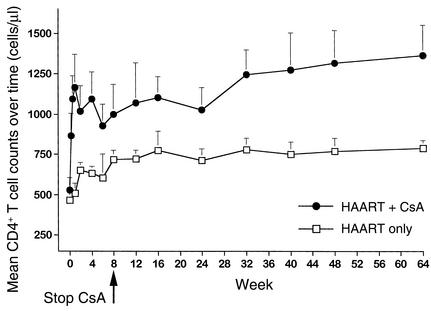
Figure 3.
Mean CD4+ T cell counts over 64 weeks of follow-up in patients belonging to the HAART only cohort (n = 29) and to the CsA plus HAART cohort (n = 9). CsA was discontinued in all patients at week 8. Student t test P values of comparisons between the two treatment cohorts were: P = 0.01 at week 1, P = 0.04 at week 2, P = 0.02 at week 4, P = 0.07 at week 8, P = 0.04 at week 16, P = 0.05 at week 24, P = 0.015 at week 32, P = 0.02 at week 40, P = 0.03 at week 48, and P = 0.007 at week 64. Data are presented as mean ± SEM. A two-tailed P value less than 0.05 was considered significant. The number of CD4+ T cells is expressed in cells/μl.

