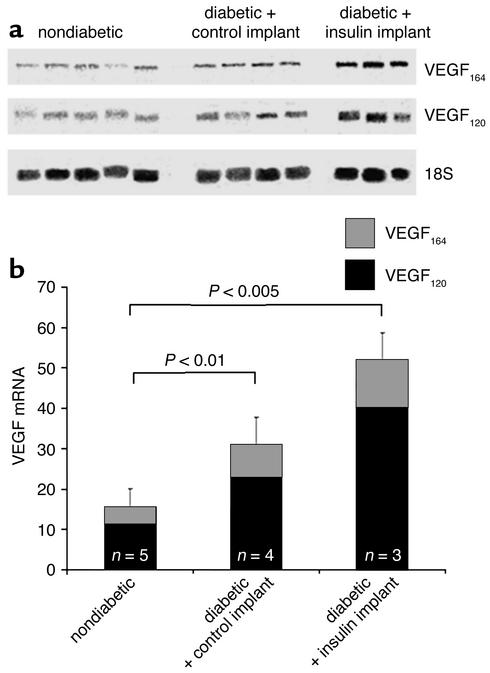
Figure 3.
(a) RPA of the retinal VEGF mRNA levels. VEGF120, VEGF164, and 18S mRNA is shown. The figure shows protected fragments from nondiabetic animals, diabetic animals treated with control implants, and diabetic animals treated with insulin implants. (b) VEGF/18S mRNA signal ratio quantitation. After normalization to the 18S signal, VEGF mRNA levels were increased 94.4% following the induction of diabetes (15.47 ± 4.6 to 30.07 ± 6.7, n = 4–5 per condition, P < 0.01 vs. nondiabetic animals), and another 70% in the insulin-treated animals (51.1 ± 10.4, n = 3–5, P < 0.005 vs. nondiabetic animals).

