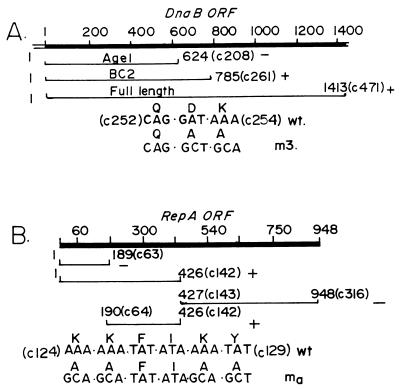
Figure 2.
Summary maps of DnaB and RepA that were used in the RepA–DnaB interaction experiments. (A) The ORF of dnaB showing the nucleotide coordinates at the top. The coordinate 1 is the first residue of the ATG initiator codon. The coordinates of the two N-terminal peptides AgeI and BC2 are shown in nucleotides and within brackets in codon numbers (e.g., c1-c208 for AgeI). The location of the m3 double mutant D253A, K254A are shown. The + and − symbols indicate positive and negative protein–protein interaction, respectively, between immobilized dnaB and RepA in solution. (B) The ORF of RepA is shown with nucleotide coordinates at the top. The nucleotide 1 corresponds to the first residue of the ATG initiator. The N-terminal and C-terminal peptides are identified by nucleotide coordinates and by codon number designation in parenthesis. The + and − symbols mark the peptides showing positive and negative interaction, respectively, with DnaB. The ma quadruple mutant of RepA (K124A, K125A, K128A, and Y129A) and the nucleotide substitutions that were used to generate the mutant are shown.

