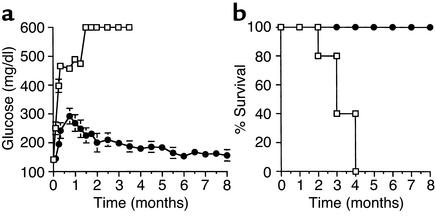
Figure 4.
(a) Blood glucose levels before and after STZ treatment of mice. Glucose concentration was determined as indicated in Methods. Squares, nontransgenic mice (n = 15); circles, transgenic mice (n = 15). (b) Percent survival of nontransgenic (squares; n = 20) and transgenic (circles; n = 20) mice after STZ treatment. Results are mean ± SEM of the indicated mice.

