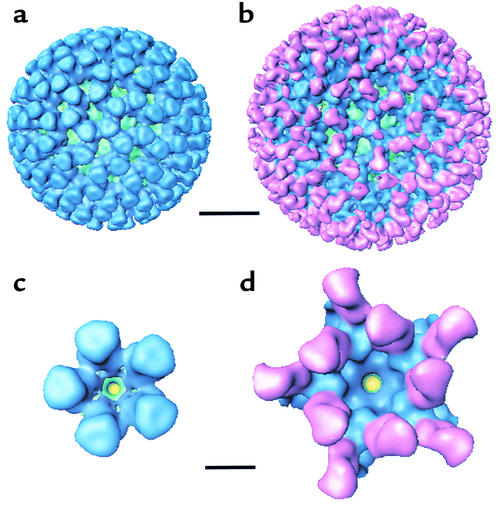
Figure 4.
(a and b) Surface representations of the three-dimensional structure of native DLP (a) and 7D9 DLP:IgA complex (b), viewed along the icosahedral threefold axis. The VP2 capsid layer is shown in green, VP6 in blue, and IgA in pink. Scale bar, 200 Å. (c and d) Surface representations of the mRNA release channel computationally isolated from the native DLP (c) and the 7D9 DLP:IgA complex (d). Scale bar, 50 Å.

