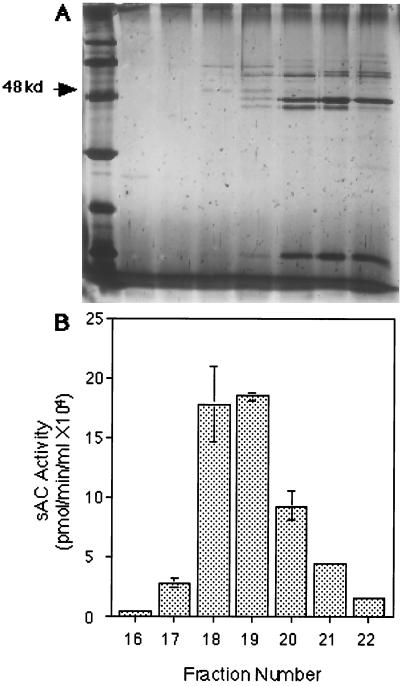
Figure 1.
Purification of sAC. (A) Silver stained gel and (B) activity profile of selected fractions from Analytical QA column chromatography. Ten-microliter aliquots of selected fractions were separated on a 12% SDS/PAGE gel and silver stained. The first lane is low molecular weight silver stain marker, and each subsequent lane corresponds to the fraction assayed for sAC activity beneath it. Bars represent the average sAC activity in duplicate assays for each fraction. Error bars indicate the standard deviation from the mean.

