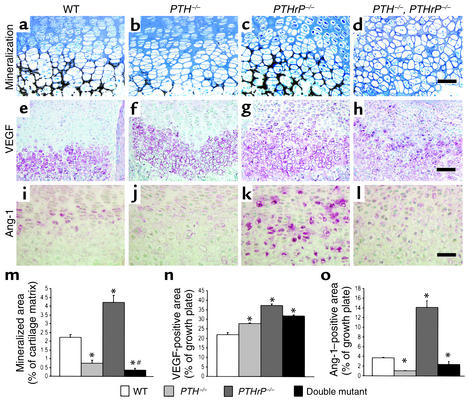
Figure 4.
Examination of cartilage matrix mineralization and angiogenesis regulators. (a–d) Undecalcified sections of femurs from wild-type; PTH–/–; PTHrP–/–; and PTH–/–, PTHrP–/– mice were stained with von Kossa stain as described in Methods. (e–h) Paraffin-embedded sections were immunostained for VEGF as described in Methods. (i–l) Sections were immunostained for Ang-1. Scale bars in d, h, and l represent 50 μm. (m) The mineralized area as a percent of the cartilage matrix per field was determined by image analysis as described in Methods and is presented as the mean ± SEM of triplicate determinations. (n) The VEGF-immunopositive area as a percentage of the growth plate field was determined by image analysis and is presented as mean ± SEM of triplicate determinations. (o) The immunopositive area of Ang-1 as a percentage of the growth plate field was determined by image analysis and is presented as the mean ± SEM of triplicate determinations. *P < 0.05, mutant mice relative to wild-type mice. #P < 0.05, compound mutant mice relative to PTH–/– mice or PTHrP–/– mice.

