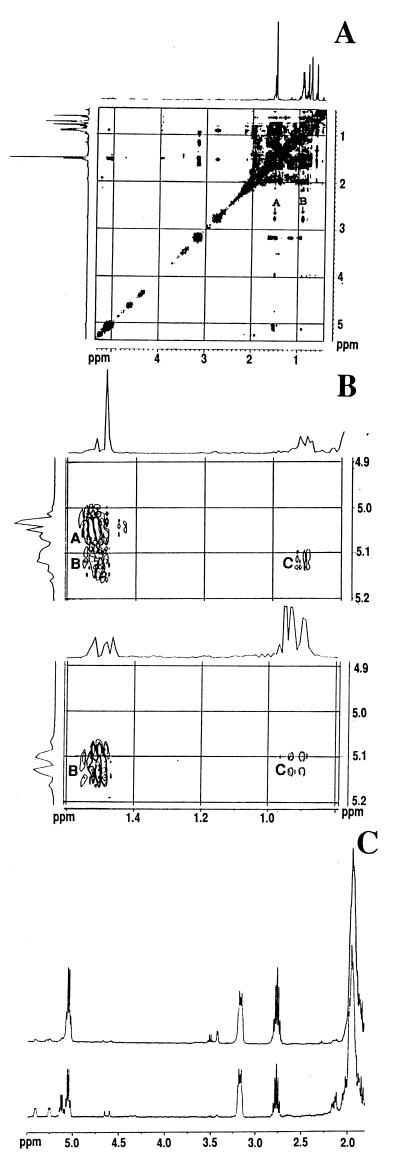
Figure 4.
NMR analyses. (A) The NOESY spectrum of the synthetic mixture at 400 MHz. The “normal” one-dimensional spectrum lies along the diagonal, and cross peaks are observed off the diagonal at the chemical shifts of two protons that are in close proximity with each other. The expected cross peaks between the methine proton at 2.818 ppm and the C-29 methyl group at 1.521 ppm (A) and the C-26 and C-27 methyl groups at 0.916 ppm (B) of the 24Z-isomer are indicated. (B) The expanded region of the NOESY spectrum of the synthetic mixture (Upper) and of authentic fucosterol (Lower). Only one cross peak is observed between the vinyl proton at 5.097 ppm and the C-29 methyl groups of the major synthetic product at 1.521 ppm (labeled A), whereas two cross peaks are observed between the vinyl proton at 5.122 ppm and the C-29 methyl group at 1.521 ppm (labeled B) and the C-26 and C-27 methyl groups at 0.916 ppm (labeled C) for both the minor product and fucosterol. (C) The 400-MHz 1H spectra of pneumocysterol isolated from PcP lung (Upper trace) and the synthetic mixture (Lower trace). The chemical shifts of the vinyl proton on the C-28 carbon and the methine proton on the C-25 carbon are at 5.097 ppm and 2.818 ppm, respectively, for the 24Z isomer, similar to that of pneumocysterol isolated from PcP lungs.

