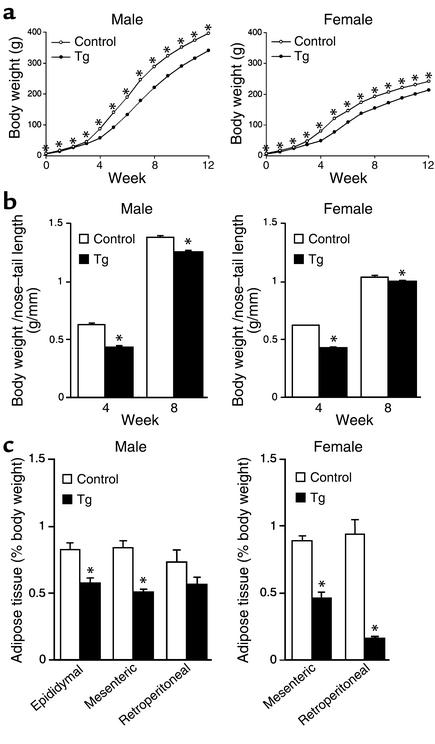
Figure 7.
Characterization of Tg rats. (a) Body weight curves. Each data point represents mean ± SEM of 8–25 rats (the error bars are smaller than the symbols for many of the data points). *P < 0.05 versus control rats. (b) Body weight/nose-tail length ratios at 4 and 8 weeks of age. Data are presented as mean ± SEM of six rats. *P < 0.05 versus control rats. (c) Adipose tissue (epididymal, mesenteric, and retroperitoneal) weight as a percentage of body weight of 8-week-old Tg rats. Columns represent the mean ± SEM of six rats. *P < 0.05 versus control rats.

