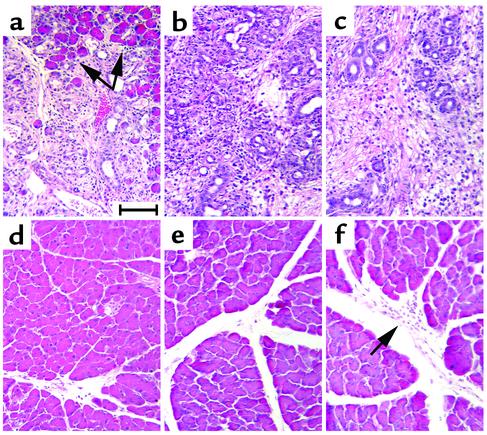
Figure 3.
Inhibition of pancreatic ductal metaplasia following duct ligation in MMP-7–/– pancreata. (a–c) Pancreatic tails of wild-type mice at (left to right) 5, 7, and 10 days after ductal ligation. Arrows in a indicate areas of persistent acinar cells. (d–f) Pancreatic tails of MMP-7–/– mice at (left to right) 5, 7, and 10 days after ductal ligation. Arrow in f indicates inflammatory cell infiltrate. Scale bar in each panel represents 100 μm.

