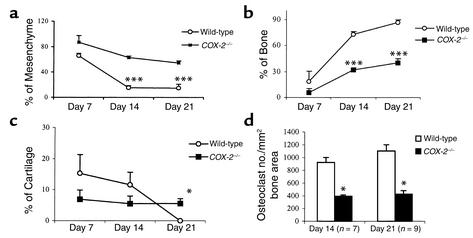
Figure 3.
Quantitative analysis of fracture callus in wild-type and COX-2–/– mice at 7, 14, and 21 days after fracture. Tissue sections from wild-type and COX-2–/– mice harvested on days 7 (n = 5), 14 (n = 7), and 21 (n = 9) after fracture were stained with Alcian blue/hematoxylin or for tartrate resistant acid phosphate (TRAP) as described in Methods. All slides were analyzed using Osteometrics software, (Osteometrics Inc., Atlanta, Georgia, USA) and percentages of mesenchymal tissue (a), bone (b), and cartilage (c) relative to the total fracture area are presented as the mean ± SEM. (d) Osteoclast numbers (TRAP-positive cells) per mm2 bone area were quantified as described in Methods and are presented as the mean ± SEM. Student’s t test was used to determine the statistical differences between each group. *P < 0.05, ***P < 0.001.

