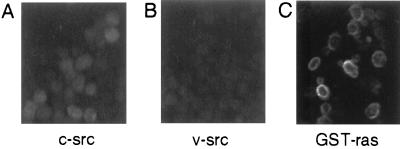
Figure 4.
Immunofluorescece analysis of c-src and v-src distribution in wild-type yeast cells. Intracellular distribution of c-src (A), v-src (B), and a GST-ras fusion protein (C). Cells were grown in raffinose medium to early logarithmic phase then transferred to galactose-containing medium for 5 hr to induce expression of the indicated protein. As expected from its lower level of accumulation, the fluorescence signal from v-src was lower than that of c-src but well above background (staining with secondary antibody in the absence of primary antibody), which was not detectable at this level of exposure (not shown).

