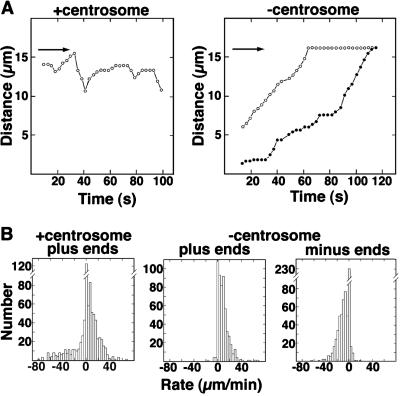
Figure 3.
Quantitation of MT dynamics in cytoplasts. (A) Life histories of MTs in cytoplasts containing (Left) and lacking (Right) the centrosome. Arrows indicate position of cell margin. In centrosome-containing cytoplasts, MT distal ends displayed alternating phases of growth and shortening. In centrosome-free cytoplasts, distal ends (○) persistently grew until they reached the cell margin whereas trailing ends (•) persistently shortened, culminating in MT disappearance. (B) Frequency histograms of rates of MT growth and shortening at distal (plus) ends of MTs in centrosome-containing cytoplasts (Left) and at distal (plus) and proximal (minus) ends of MTs in centrosome-free cytoplasts (Center and Right). Change in length was quantified for 41 MT plus ends in 7 centrosome-containing cytoplasts, and for 43 minus ends and 41 plus ends in 10 centrosome-free cytoplasts.

