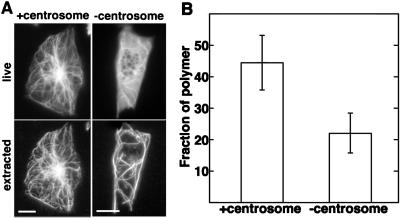
Figure 4.
Proportion of polymerized tubulin in cytoplasts. (A) Fluorescence images of MTs in cytoplasts with (Left) and without (Right) the centrosome before (Upper) and after (Lower) extraction into a MT-stabilizing buffer. MTs remained stable after lysis, but soluble tubulin was extracted. (Bars = 10 μm.) (B) Proportion of polymerized tubulin was determined ratiometrically on individual cytoplasts as integrated fluorescence after extraction divided by integrated fluorescence in the living state (13). Measurements were performed after flat-fielding and background subtraction. Results presented are for 13 centrosome-containing and 19 centrosome-free cytoplasts.

