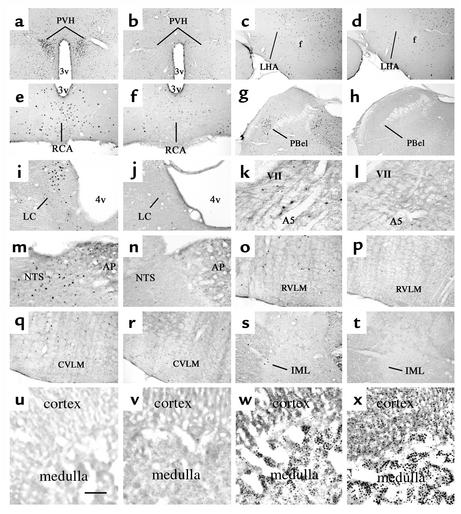
Figure 3.
Distribution of i.c.v. EXN-4–induced Fos-IR in the brain and the adrenal gland. A series of photomicrographs demonstrates Fos-IR in neurons 2 hours after i.c.v. administration of EXN-4 (a–t, first and third columns; v–x) or PFS (a–t, second and fourth columns; u) in several brain regions and the adrenal gland. The brain regions include (a and b) the PVH; (c and d) the LHA; (e and f) the Arc/RCA; (g and h) the PBel; (i and j) the LC; (k and l) the A5; (m and n) the AP and the NTS; (o and p) the RVML; (q and r) the CVLM; and (s and t) the IML in the spinal cord. In the adrenal gland, after administration of PFS, little Fos-IR is visible (u). After i.c.v. EXN-4 at subthreshold dose (v; 3 μg), a little Fos-IR is visible. In contrast, i.c.v. EXN-4 at threshold dose (w; 30 μg) or a higher dose (x; 300 μg) induces Fos-IR in the adrenal medulla. Note that at the higher dose (x), Fos-IR is also visible in the cortex. Scale bar = 500 μm in a–d, g, and h; 200 μm in e, f, and i–t; and 50 μm in u–x.

