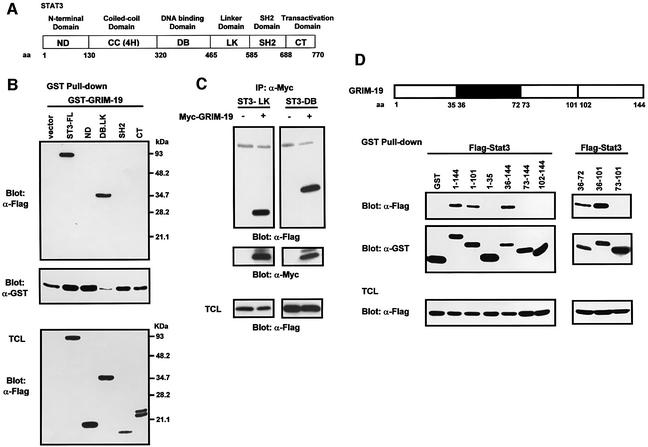
Fig. 4. Mapping of the interacting regions of Stat3 and GRIM-19. (A) Schematic diagram of Stat3 indicating its functional domains specified according to the amino acids (aa). (B and C) Identification of interacting regions of Stat3. (B) COS-1 cells were co-transfected with GST–GRIM-19 and Flag-tagged Stat3, either full-length (ST3-FL) or deletion mutants containing the N-domain (ND), DNA-binding and linker domains (DB.LK), SH2 domain or C-terminal domain (CT) as labeled on top of the figure. GST pull-down was performed, and the associated proteins were probed with anti-Flag antibody (top panel). The middle panel indicates the GST–GRIM-19 that has been pulled-down by beads. The bottom panel shows the expression of the Flag-tagged Stat3 constructs in total cell lysates. (C) For further mapping, Flag-tagged Stat3 mutant expressing either the linker domain (ST3-LK) or the DNA-binding domain (ST3-DB) was co-transfected with Myc-tagged GRIM-19 (+) or vector alone (–). The cell lysates were immunoprecipitated with anti-Myc and blotted with anti-Flag. The blot was stripped and re-blotted with anti-Myc (middle panel). Expression of ST3-LK and ST3-DB in total cell lysate (TCL) was examined by western blot analysis using anti-Flag (bottom panel). (D) Identification of interacting regions on GRIM-19. GST–GRIM-19 fusions harboring various segments of GRIM-19 (as indicated by the aa numbers) were co-transfected with Flag-Stat3, and GST pull-down experiments were performed. The top panels show Stat3 co-precipitated with GST–GRIM-19. The middle panels show GST and the various GST–GRIM-19 fusion proteins pulled-down by glutathione–Sepharose beads, and the bottom panels indicate the expression of Stat3. The schematic diagram of GRIM-19 is displayed on top of the figure, in which the interacting region (aa 36–72) of GRIM-19 is illustrated as a black box.

An official website of the United States government
Here's how you know
Official websites use .gov
A
.gov website belongs to an official
government organization in the United States.
Secure .gov websites use HTTPS
A lock (
) or https:// means you've safely
connected to the .gov website. Share sensitive
information only on official, secure websites.
