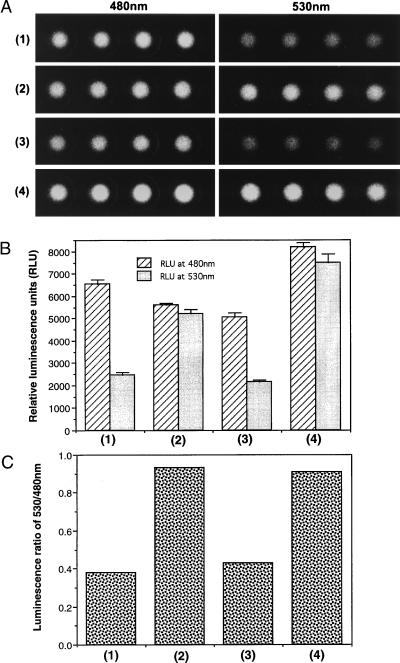
Figure 4.
Imaging and quantification of BRET luminescence from transformed E. coli strains. (A) Bioluminescence visualized through interference bandpass filters transmitting light of 480 ± 5 nm (left side) or 530 ± 5 nm (right side). Row 1 is the strain producing only RLUC; row 2 is the strain expressing the RLUC•EYFP fusion protein; row 3 is the strain expressing the fusion proteins RLUC•KaiB and EYFP•KaiA; and row 4 is the strain producing the fusion proteins RLUC•KaiB and EYFP•KaiB. Luminescence reactions were initiated by the addition of 3 μM coelenterazine. (B) Quantification of luminescence intensity in relative light units at 480 nm and 530 nm of the cultures imaged in A. (C) Calculation of the 530 nm/480 nm ratios for the data of B. For B and C, strains are labeled as in A: (1) RLUC, (2) RLUC•EYFP, (3) RLUC•KaiB and EYFP•KaiA, and (4) RLUC•KaiB and EYFP•KaiB.

