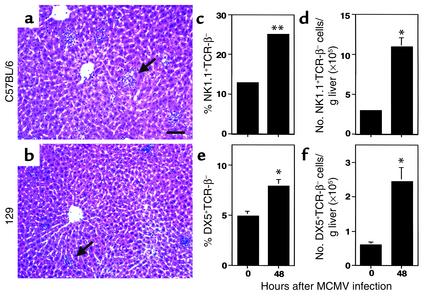
Figure 1.
NK cell accumulation in MCMV-infected C57BL/6 and 129 livers. Livers were harvested and H&E-stained tissue sections were prepared from C57BL/6 (a) or 129 (b) mice infected with MCMV for 48 hours as described in Methods. Arrows in a and b denote inflammatory foci. Images were digitally captured at the original magnifications of ×10. Scale bar = 100 μm. (c–f) Liver leukocytes were prepared from C57BL/6 (c and d) or 129 (e and f) mice that were uninfected (0 hours) or infected with MCMV for 48 hours. Leukocytes were analyzed by flow cytometry as described in Methods. Both the percentage (c and e) and number (d and f) of NK1.1+TCR-β– or DX5+TCR-β– cells per g liver are shown. Data are the means ± SE (n = 3–6). Differences between uninfected and infected mice are significant at *P ≤ 0.03 and **P < 0.001.

