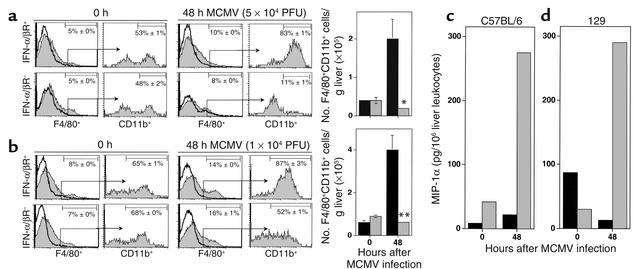
Figure 8.
Characterization of IFN-α/β–mediated effects on macrophage accumulation and of MIP-1α–producing cells in liver during MCMV infection. Liver leukocytes were prepared from 129-IFN-α/βR+ or 129-IFN-α/βR– mice that were uninfected or infected with moderate-dose (a) or low-dose (b) MCMV for 48 hours. Leukocytes were analyzed by flow cytometry as described in Methods. Macrophages were identified by F4/80 expression and are shown by histograms (a and b). The accumulation of migrating populations was subsequently identified by analyses of CD11b expression after gating on the F4/80+ population and is shown by histograms (a and b). The data shown are representative histograms, with thick lines representing isotype control antibody and shaded histograms F4/80 or CD11b labeling. Percentages presented in each histogram are means ± SE (n = 3–4). Numbers of F4/80+CD11b+ cells per g liver isolated from 129-IFN-α/βR+ (black bars) or 129-IFN-α/βR– (gray bars) are shown (a and b). Data represent the means ± SE (n = 3–4). Differences between control IFN-α/βR+ and IFN-α/βR– are significant at *P ≤ 0.03 and **P ≤ 0.01. (c and d) Total (black bars) or enriched F4/80+CD11b+ (gray bars) liver leukocytes were prepared from C57BL/6 (c) or 129 (d) mice that were uninfected or infected with low-dose MCMV for 48 hours. Leukocyte-CM was used to measure MIP-1α in ELISA as described in Methods. Levels of detection were 0.2 pg/million cells. Each group consisted of pooled cell samples from six mice. The data shown are representative of two independent experiments.

