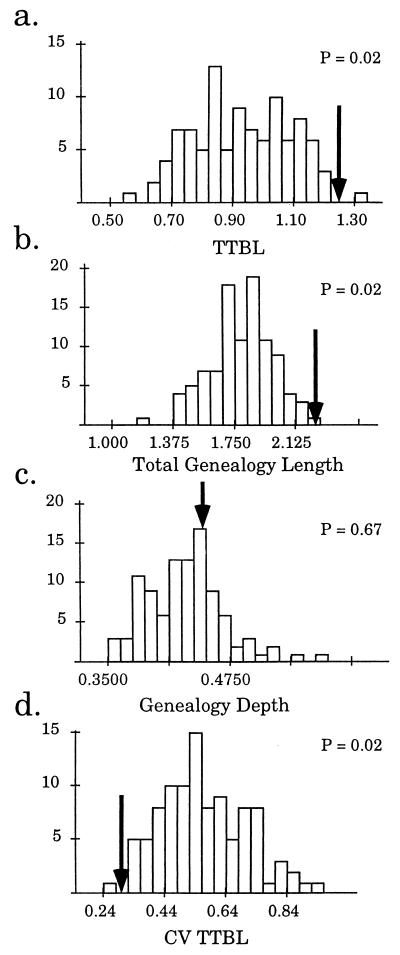
Figure 2.
Frequency distributions for statistics of S allele genealogies generated by randomly resampling subsets of P. crassifolia sequences. Arrows indicate the value of these statistics for P. cinerascens. (a) TTBL, the sum of the lengths of all terminal branches. (b) Total length of the genealogy, the sum of all branch lengths. (c) Depth of the genealogy, the sum of the branches from the base to any terminal tip. (d) The coefficient of variation (CV) of TTBL.

