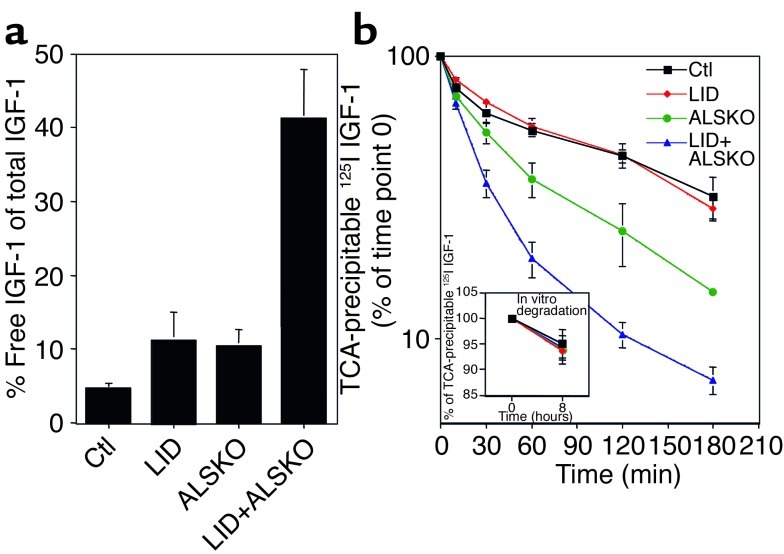
Figure 2.
Serum levels of free IGF-1 and clearance studies. (a) Levels of total IGF-1 and free IGF-1 were measured by RIA in the same serum samples. Graph shows free IGF-1, expressed as a percentage of total IGF-1, in control (n = 6 samples, drawn from a tube containing 23 pooled samples), LID (n = 5 from 19 pooled samples), ALSKO (n = 9 from 35 pooled samples), and LID+ALSKO mice (n = 9 from 64 pooled samples). (b) Serum clearance of 125I–IGF-1 in the various genotypes. Serum was obtained from the retro-orbital vein at the intervals shown after 125I–IGF-1 was injected into control (n = 3), LID (n = 3), ALSKO (n = 3), and LID+ALSKO (n = 3) mice. The percentage of TCA-precipitable 125I is expressed as the ratio of TCA-precipitable 125I at an indicated time divided by TCA-precipitable 125I at 0 time point. Inset shows in vitro degradation of 125I–IGF-1 protein, expressed as the ratio of TCA-precipitable 125I divided by total count.

