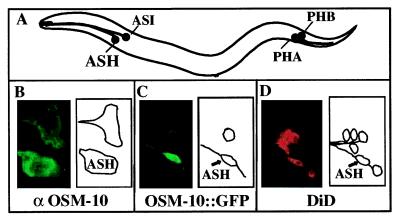
Figure 1.
Overview of the system. (A) A schematic presentation of a nematode, indicating the positions of neurons that express the osm-10 gene. Neurons are referred to by their class designation, e.g., ASHL and ASHR as ASH. (B) (Left) ASH and ASI visualized by using the OSM-10 antiserum. (Right) Diagrammed presentation of the stained neurons. (C) (Left) ASH and ASI visualized in transgenic animals expressing OSM-10∷GFP. (Right) Diagrammed presentation of the stained neurons. (D) (Left) DiD stains six classes of neurons, including the ASH, in the head. (Right) Diagrammed presentation of the stained neurons.

