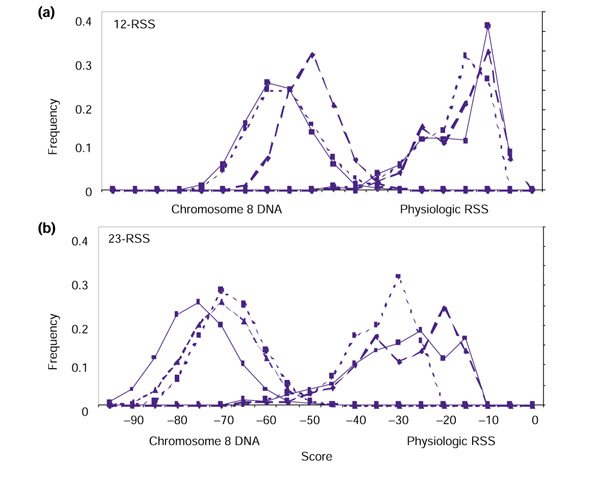
Figure 3.

Plots of scores computed for physiologic RSS, and for 28- or 39-bp segments taken from chromosome 8 DNA. (a) 12-RSS; (b) 23-RSS. The y-axis indicates the frequency of physiologic RSS or of segments from chromosome 8 with a finite score that score at the level given on the x-axis. Solid line, RIC; dashed line, WM1; dotted line, WM0.
