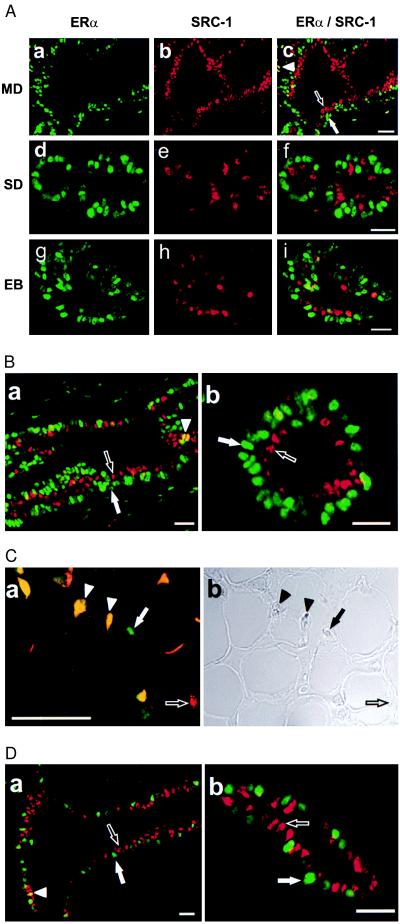
Figure 2.
Segregation of SRC-1 expression from ERα-positive cells as illustrated by the dual immunofluorescent labeling of SRC-1 and ERα. (A) Mammary glands from 3-week-old virgin female rats were stained simultaneously for SRC-1 (b, e, and h; red) with GT12 and for ERα (a, d, and g; green) with MC-20. Green and red images were superimposed (c, f, and i). Main duct (MD), small duct (SD), and end bud (EB) are shown. (B) The discrete distribution pattern of ERα (green) and SRC-1 (red) was confirmed with the combination of 6F11 and M-20 antibodies (a and b). (C) Stroma expressing ERα alone (green), SRC-1 alone (red), or both (yellow) were detected with GT12 and MC-20 antibodies (a) as in A. The phase contrast image from a is shown in b. (D) Staining from 10-week-old virgin female rat mammary gland also demonstrated the segregation of SRC-1 from ERα in epithelial cells. MC-20 and GT12 were used as the primary antibodies. Solid arrow, Cells expressing only ERα; open arrow, cells expressing only SRC-1; solid arrowhead, cells expressing both ERα and SRC-1. (Bar = 100 μm.)

