
Figure 3.
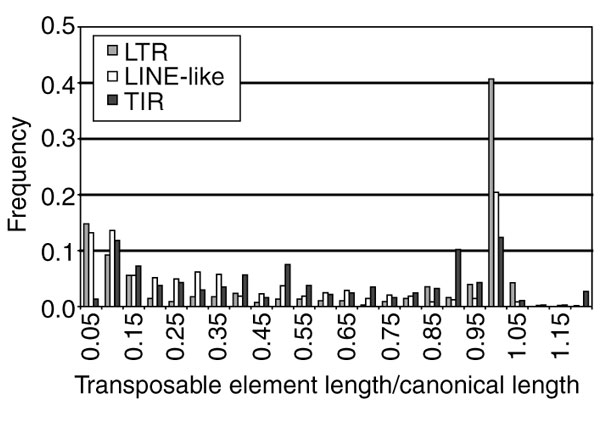
Frequency distribution of transposable element lengths scaled relative to their canonical lengths. Plotted are the scaled lengths of individual elements by functional class: LTR (gray), LINE-like (white), and TIR (black). Mann-Whitney U tests among all three classes (LTR versus LINE-like, LTRversusTIR, and LINE-like versus TIR) reveal that the distribution of scaled element lengths differ significantly between functional classes (Mann-Whitney U test, p < 1 × 10⁻⁴).