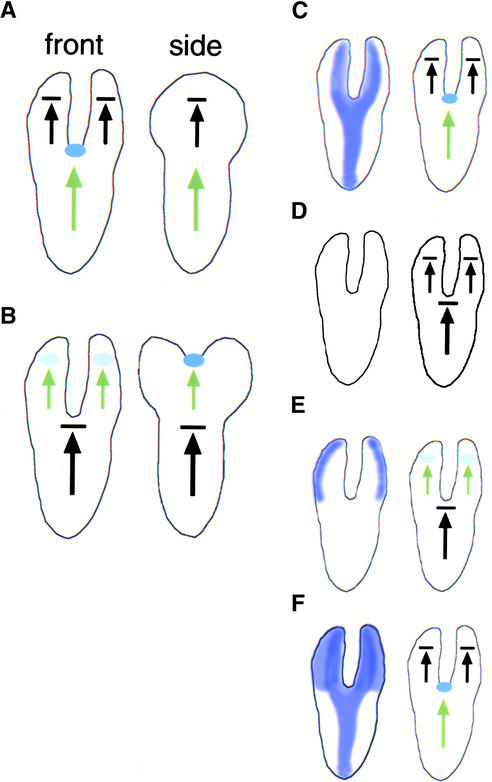
Figure 9.
Models.
(A) and (B) Cartoons of the front and side views of wild-type (A) and pnh; FIL::PNH (B) embryos. Black arrows indicate determinate axes, and green arrows indicate indeterminate axes. SAM precursors are indicated with blue ovals. Compare the side view of the cotyledon in (B) with the front view of the embryo in (A).
(C) to (F) Cartoons of embryos depicting the PNH expression domain in purple (left) and the behavior of the growth axes (right). Genotypes depicted are wild type (C), pnh (D), pnh; FIL::PNH (E), and PNH; FIL::PNH (F).

