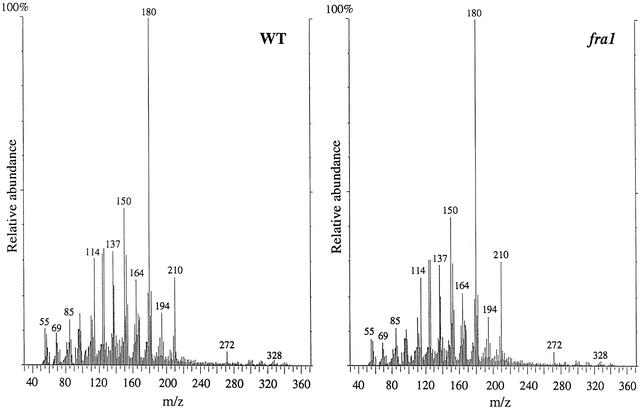
Figure 3.
In-Source Pyrolysis Mass Spectrometry of Cell Walls of Mature Stems of the Wild Type and the fra1 Mutant.
In-source pyrolysis mass spectrometry was performed using a Finnigan GCQ mass spectrometer equipped with a direct exposure probe (rhenium loop). Mass peaks of guaiacyl lignin had mass-to-charge ratio (m/z) values of 124, 137, 138, 150, 152, 164, 166, 178, and 180. Mass peaks of syringyl lignin had m/z values of 154, 167, 168, 180, 182, 194, 196, 208, and 210. Mass peaks of cellulose and amylose had m/z values of 57, 60, 73, 85, 86, 96, 98, 100, 102, 110, 112, 126, and 144. Mass peaks of hemicellulose had m/z values of 58, 85, 86, and 114. Note that there are no apparent differences in the relative intensities of mass peaks for cell wall polysaccharides and lignin between the wild type (WT) and the fra1 mutant.

