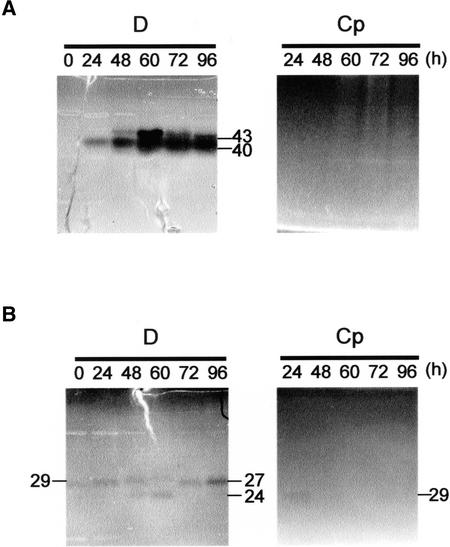
Figure 2.
Detection of DNase Activities during TE Differentiation.
Samples of protein extracts (10 μg of protein per lane) from Zinnia cells cultured for various periods in TE-inductive medium (D) or a control medium (Cp) were separated by SDS-PAGE using denatured calf thymus DNA as a substrate. After preincubation in 10 mM Tris-HCl, pH 7.5, containing 1 mM EDTA for 1 h, gels were incubated for another 12 h in different reaction buffers: 25 mM sodium acetate–acetic acid buffer, pH 5.5, containing 5 mM ZnSO4 (A) or 10 mM Tris-HCl, pH 7.5, containing 10 mM CaCl2 and 10 mM MgCl2 (B). Background substrate was stained with ethidium bromide to visualize DNase bands. The predicted molecular mass of each band is presented in kD.

