Figure 5.
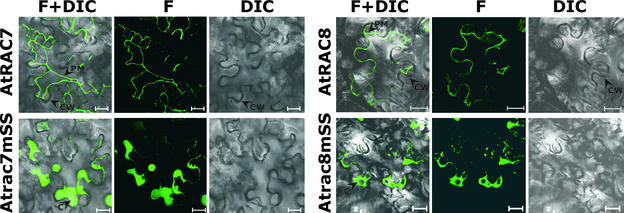
Plasmolysis of N. benthamiana Cells Expressing GFPAtRAC7, GFPAtRAC8, and Their Corresponding Double-Cys Mutants.
After plasmolysis, GFP fluorescence was detected in the plasma membrane of cells that expressed GFPAtRAC7 (AtRAC7) or GFPAtRAC8 (AtRAC8). GFP fluorescence had a typical cytoplasmic distribution after plasmolysis of cells that expressed GFPAtrac7mSS203+206 (Atrac7mSS) and GFPAtrac8mSS199+205 (Atrac8mSS). All images are from confocal scans performed with a confocal laser scanning microscope. DIC, Nomarsky differential interference contrast image; F, GFP fluorescence image; F+DIC, overlay of fluorescence and DIC images. Arrowheads point to the plasma membrane (PM), cytoplasmic thickening (C), and cell walls (CW). Bars = 20 μm.

