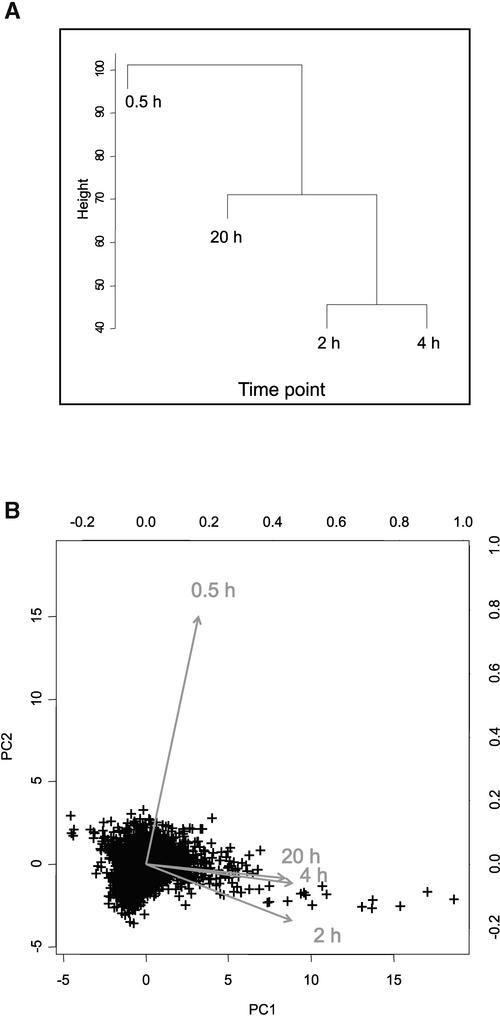
Figure 2.
The Low-Oxygen Response Consists of Different Stages.
Data from the first time point (0.5 h) are not correlated with data from the other three time points.
(A) Dendrogram of relationships between data from the four time points (averaged for each gene) as determined by cluster analysis.
(B) Principal component analysis (PC1 and PC2) of the data from the four time points (averaged for each gene). The data are presented as a biplot, incorporating the gene effects (scores) as points and the treatments (loadings) as vectors (Gabriel, 1971; Chapman et al., 2002). Vectors that are close together are highly correlated in terms of the gene effects observed for each treatment, whereas vectors that are orthogonal are poorly correlated. Points (genes) that are near the origin of the biplot are either not expressed differentially in all treatments or are explained poorly by the principal component analysis. Points (genes) that are close to the head of a vector have high positive expression values in that treatment, whereas genes on the opposite side of the origin, relative to the head of the vector, have negative expression values for that treatment. The relative expression level of any combination of gene and treatment can be determined by a perpendicular projection of a point onto a vector.

