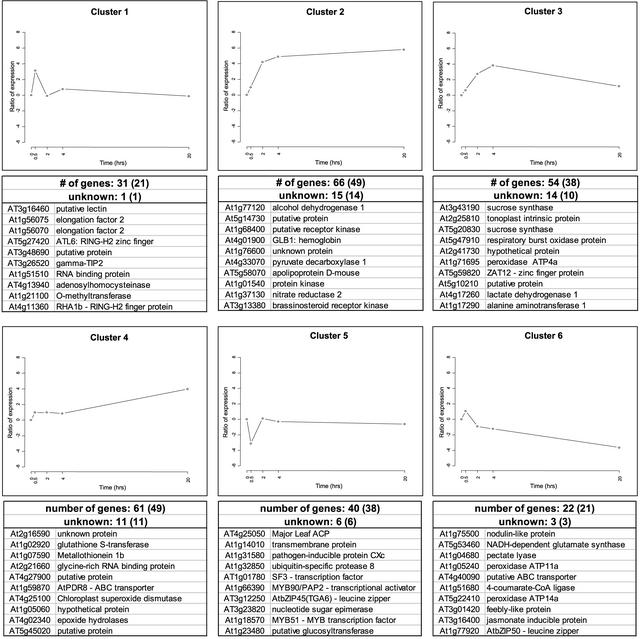
Figure 4.
Expression Profiles of Genes Expressed Differentially under Low-Oxygen Stress.
The graphs represent the means of expression for each cluster (see Figure 5). The y axis is in log base 2 units. The total number of genes and the number of unknown genes is indicated, with the number of nonredundant genes shown in parentheses. For each expression profile, the 10 most highly induced or repressed genes are listed with both open reading frame identifiers and functions. The complete list of differentially expressed genes is available in the supplemental data online.

