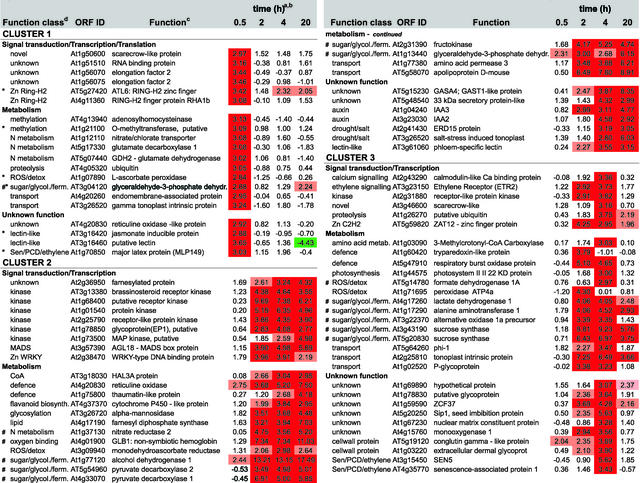
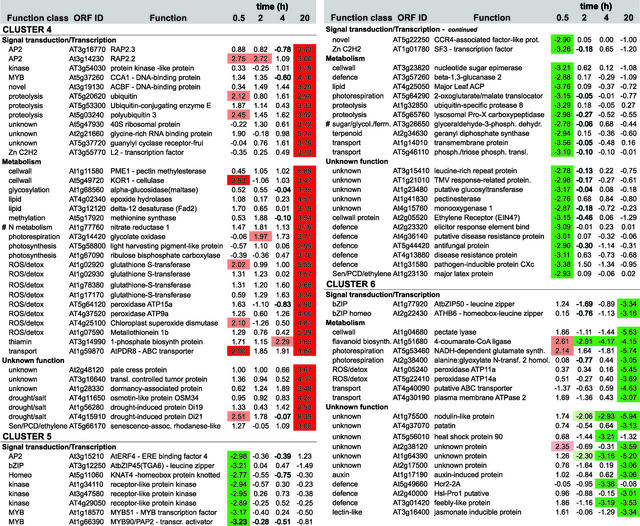
Figure 5.
Expression Profiling and Functional Clustering of Genes Differentially Expressed by Low-Oxygen Stress.
Genes with differential expression pattern under low oxygen conditions are grouped in 6 clusters according to their induction profile. Values in the table are ratios of low-oxygen treated compared to aerated roots for the time given, and are transformed (log base 2, so ratio = 2n) and normalised. Positive values indicate induction, whereas negative values indicate repression. High induction is shaded in red, high repression in green; levels of differential induction are indicated by pale red (1.96>n>2.75) and dark red (n>2.75), and the same applies for the levels of repression as indicated by the green colours. Clones from unknown, putative, or hypothetical proteins are not shown, nor are redundant clones. The complete list, including unknown and redundant clones, Genbank accession numbers, clone IDs, gene descriptions, and literature references can be found via the online version of this publication. Known ANPs (#) and transition proteins (*) are indicated.


