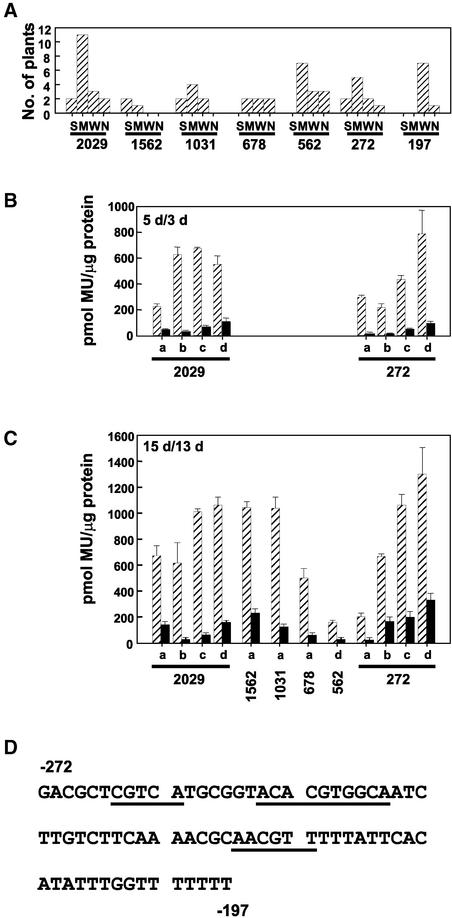
Figure 5.
A 75-bp Promoter Region That Is Important for FLC Expression Contains Three Potential b-ZIP Binding Sites.
(A) Distribution of staining intensities for seven FLC::GUS promoter deletion constructs. The length of FLC sequence (in bp), upstream of the ATG, present in the construct is given below each graph. Each construct also contained the 4-kb intragenic sequence. The construct with 2029 bp of promoter is the 6-kb construct in Figures 1 to 3. Except for the 197-bp construct, each independent line was classified as strong (S), medium (M), weak (W), or no staining (N), as described in Methods. Strong, medium, and weak staining equates to >700, 350 to 700, and <350 pmol of 4-methyl umbelliferone (MU) per microgram of protein, respectively, in (C). For the 197-bp construct, W indicates weak expression in stipules only, not in other tissues.
(B) Methylumbelliferyl-β-d-glucopyranoside activity data for four selected lines (a to d) for the two FLC::GUS constructs with either 2029 or 272 bp of FLC promoter for 3-day-old vernalized (black bars) and 5-day-old nonvernalized (hatched bars) seedlings. Error bars represent the standard error.
(C) Methylumbelliferyl-β-d-glucopyranoside activity data for up to four selected lines (a to d) for the promoter deletion constructs in (A) for 13-day-old vernalized (black bars) and 15-day-old nonvernalized (hatched bars) plants. Error bars represent the standard error. The 272-bp line d is shown in Figure 4.
(D) Sequence of the 75-bp region with potential b-ZIP recognition motifs underlined.

