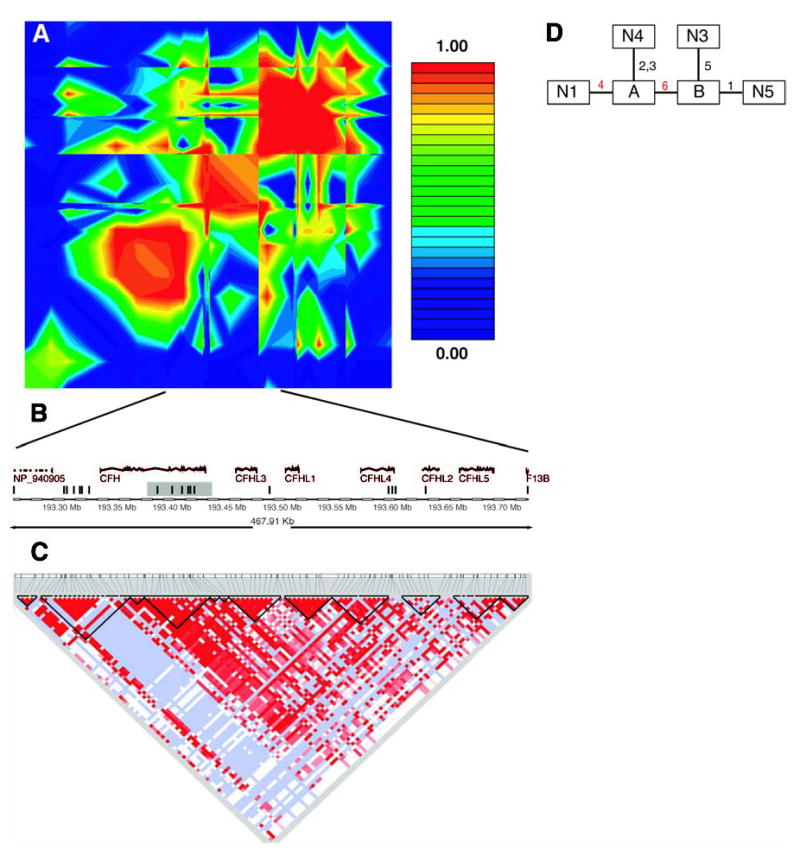
Fig. 2.

(A) Linkage disequilibrium across the CFH region, plotted as pairwise D′values. The red/orange box in the center of the plot is the region in strong linkage disequilibrium with the two associated SNPs in our data. (B) Schematic of the region in strong linkage disequilibrium with the two associated SNPs in our data. The vertical bars represent the approximate location of the SNPs available in our data set. The shaded region is the haplotype block found in the Hap-Map data. (C) Haplotype blocks in the HapMap CEU data cross the region. Darker shades of red indicate higher values of D′. Light blue indicates high D′with a low logarithm of the odds ratio for linkage (lod score). The dark lines show the boundaries of haplotype blocks. (D) Maximum-parsimony cladogram derived from haplotypes across the 6-SNP region. The number near each line indicates which of the six SNPs changes along that branch. The two red numbers are the two SNPs initially identified as being associated with AMD. SNP 4 is rs380390 and SNP 6 is rs1329428.
