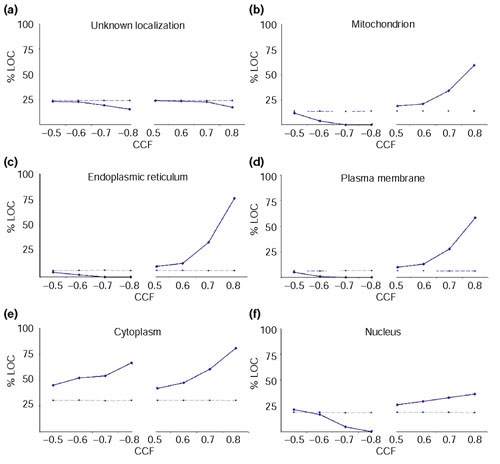
Figure 2.

Proteins localized in the same compartment tend to be expressed at the same time. The plots show the trend for the percentage of genes from the same compartment (%LOC, y-axis) with respect to the total number of genes to which they correlate at a given threshold (CCF, x-axis). The solid lines correspond to the values obtained from the experimental data, whereas the dashed lines are the values expected by chance. The expected trend matches with that of a set of proteins with unknown localization (a), in contrast to sets of proteins with identified compartment: (b) mitochondrion, (c) endoplasmic reticulum, (d) plasma membrane, (e) cytoplasm and (f) nucleus.
