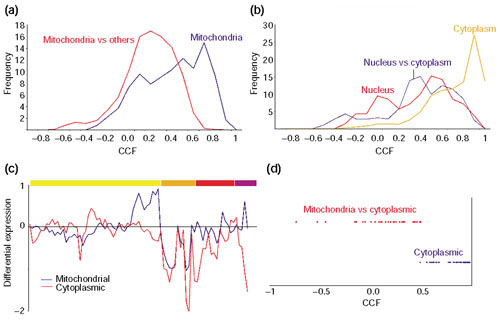
Figure 7.

Cytoplasmic versus mitochondrial translation machinery. (a, b) The distribution of CCF values for gene pairs in which both members belong to the COG functional category J, protein translation. (a) The distribution of CCF values for gene pairs in which both members are mitochondrial proteins (dark blue) or one member is mitochondrial and the another one is not (red). (b) The distribution of CCF values for gene pairs in which both members are cytoplasmic (orange), both nuclear (red), or one member is cytoplasmic and the another one is nuclear (dark blue). (c) The averaged expression profiles of the mitochondrial translation machinery (dark blue) and the set of genes involved in protein translation in the cytoplasm, including those involved in the metabolism of sugar, amino acids and nucleotides, as well as RNA processing proteins and polymerases. The color-coding for the experiments is the same as in Figure 4. (d) Distribution of CCF values for pairs of genes that belong to the same COG. The cytoplasmic pairs (dark blue) correspond to paralog-paralog relationships whereas the ones involving cytoplasmic and mitochondrial proteins (red) correspond to orthologs. The expression of duplicated genes can be distinguished from each other because even though two genes can encode two proteins with identical amino-acid sequences, the degree of identity at the DNA level can be low enough to make a selective DNA hybridization onto the chip feasible. This seems to be the case for the genes analyzed in (d).
