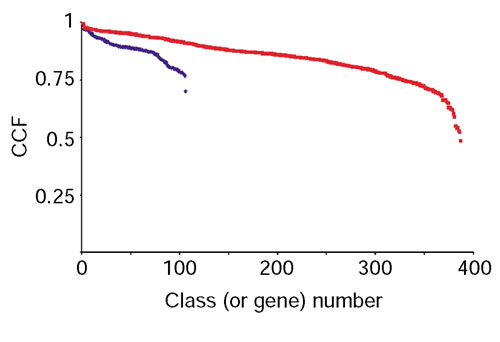
Figure 9.

The range of CCF values for the selected classes and their genes. The red dots are the CCFs of the expression profiles of all the genes versus the averaged profile of the class they belong to. The blue points correspond to the means after averaging the CCFs of all the genes within a class.
