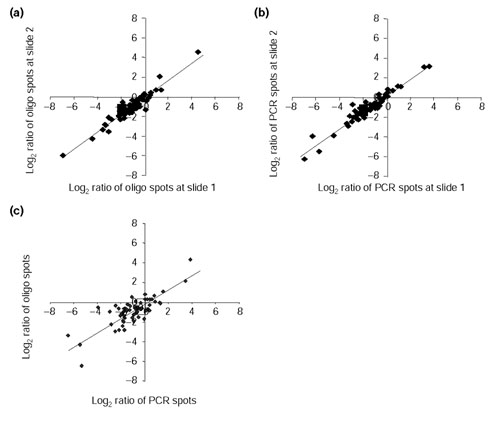
Figure 4.

Scatter plots of ratios from replicate experiments for both 70-mer and PCR amplicon probes. (a) Plot of log2 ratios detected by oligonucleotide probes from two independent experiments. The plot shows a high correlation between experiments with a correlation coefficient (r) of 0.95 and a slope of 0.89. Results are representative of five similar comparisons. (b) Plot of log2 ratios detected by PCR amplicons from two independent experiments. The plot shows a high correlation between experiments, with r = 0.96 and a slope of 0.84. Results are representative of five similar comparisons. (c) Correlation of gene-expression ratios detected by 70-mer and PCR amplicon probes. A high r of 0.80 and a slope of 0.73 were obtained when log2 ratio values from oligonucleotide probes were plotted against PCR amplicons. Results are representative of five similar comparisons.
