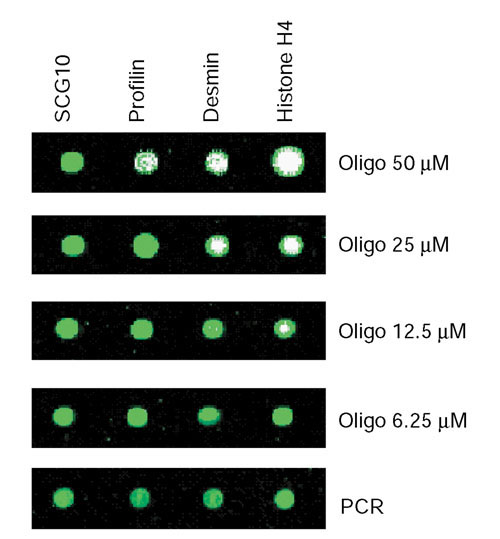
Figure 6.

Serial dilution of 70-mer oligonucleotides compared to PCR amplicons. The array was stained with Vistra Green dye. A representative grid of oligonucleotides at each concentration, along with a single concentration of the corresponding PCR amplicon (100-200 ng/μl) is shown. Results are representative of three independent experiments.
