
Figure 3.
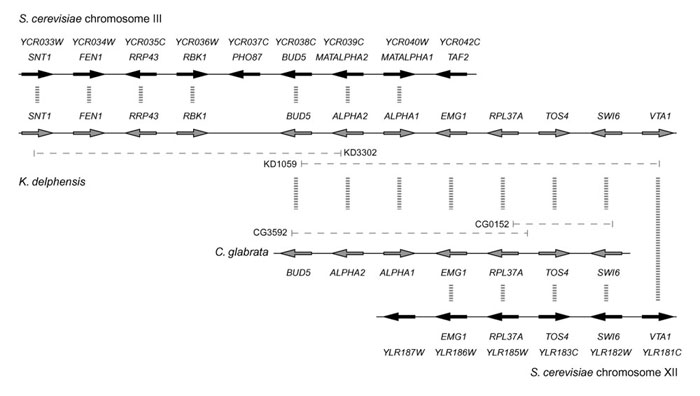
Gene organization (not to scale) around the MAT locus of S. cerevisiae and the putative MAT loci of K. delphensis and C. glabrata. Dashed horizontal lines indicate the extents of the clones sequenced.
Official websites use .gov
A
.gov website belongs to an official
government organization in the United States.
Secure .gov websites use HTTPS
A lock (
) or https:// means you've safely
connected to the .gov website. Share sensitive
information only on official, secure websites.
Gene organization (not to scale) around the MAT locus of S. cerevisiae and the putative MAT loci of K. delphensis and C. glabrata. Dashed horizontal lines indicate the extents of the clones sequenced.