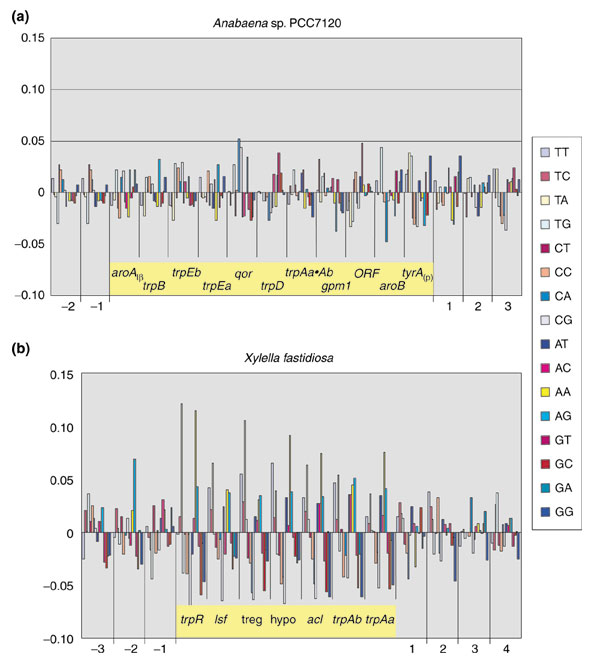
Figure 7.

Three-to-one dinucleotide analysis. (a) The aroAIβ-tyrAc gene block in Anabaena. Deviations from genomic frequencies are expressed as positive (upward-pointing bars) or negative (downward-pointing bars) percentages. (b) For comparison, the results obtained for the low-GC gene block of X. fastidiosa (of which Figure 4 is a subset). The gene blocks of interest are highlighted in yellow, and the flanking genes are indicated by numbers.
