
Figure 1.
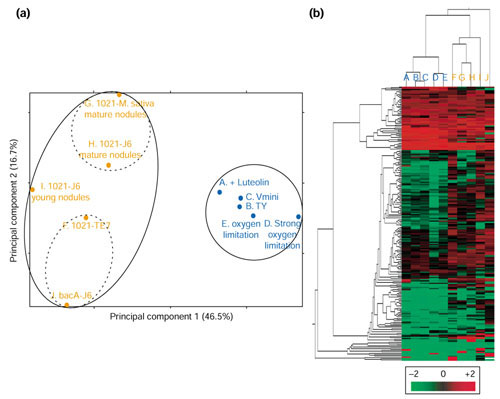
Global analysis of gene expression profiles in liquid cultures and symbiotic conditions. (a) Principal component analysis. Projection on the two main axes of principal gene analysis. A-E (blue) are profiles derived from cultured bacteria. A, minimal medium (Vmini) + 10 μM luteolin; B, rich medium; C, aerated Vmini; D, microoxic Vmini (strong oxygen limitation); E, microoxic Vmini. F-J (orange) are profiles derived from symbiotic bacteria. F, 1021-TE7; G, 1021-M. sativa; H, 1021-J6 mature nodules; I, 1021-J6 young nodules; J, bacA-J6. (b) Hierarchical clustering of gene-expression data. Each row represents a separate gene target (PCR product) on the macroarrays and each column (A-J) a specific bacterial growth condition as indicated above. The results presented represent the normalized expression level and are depicted according to the color scale shown at the bottom.