
Figure 3.
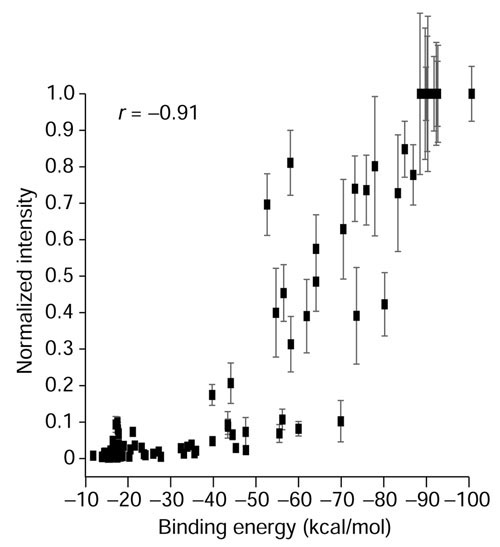
Relationship of calculated binding energy to relative hybridization intensity. For each of the oligonucleotides shown in Figure 4, a binding energy (kcal/mol) to the perfect match sequence was calculated using ArrayOligoSelector and plotted against relative hybridization intensity. The Pearson correlation coefficient |r| = 0.91 indicates a strong correlation between the calculated binding energy and hybridization performance.