
Fig. 5.
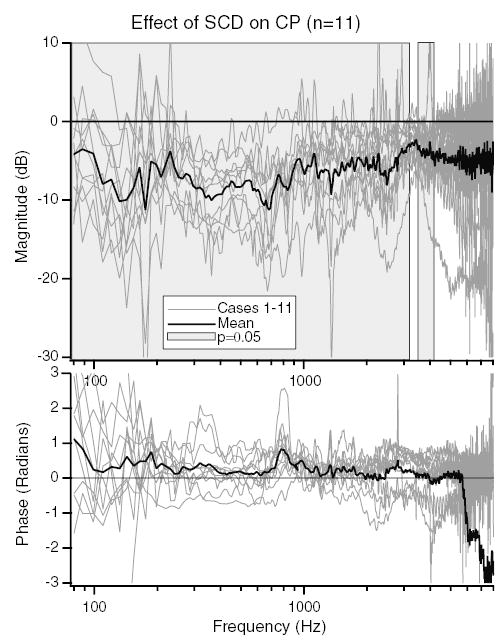
The dB difference in CP/Vstim produced by the introduction of the dehiscence in 11 ears. The light grey lines are the dB difference in CP between the post-SCD and pre-SCD states for each ear. The solid black line shows the mean dB difference. The grey shaded regions show the frequencies where the change in CP is statistically different from zero (P ≤ 0.05).