
Fig. 7.
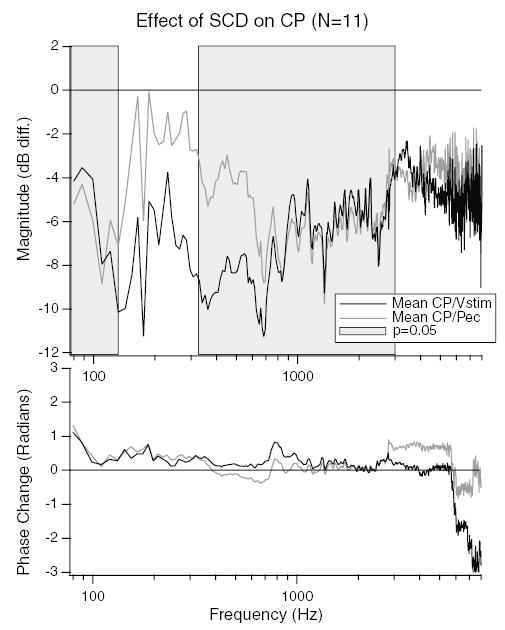
Differences between normalizing the CP by stimulus voltage and ear-canal sound-pressure. The mean dB difference in CP post- and pre-SCD normalized by stimulus voltage (CP/Vstim) (black line), and CP normalized by ear-canal sound-pressure (CP/PEC) (grey line) are illustrated. The grey shaded region shows the frequency ranges where the CP/PEC is statistically different from zero (P ≤ 0.05). A systematic difference between CP/Vstim and CP/PEC is apparent for frequencies between 130 and 700 Hz.