
Figure 1.
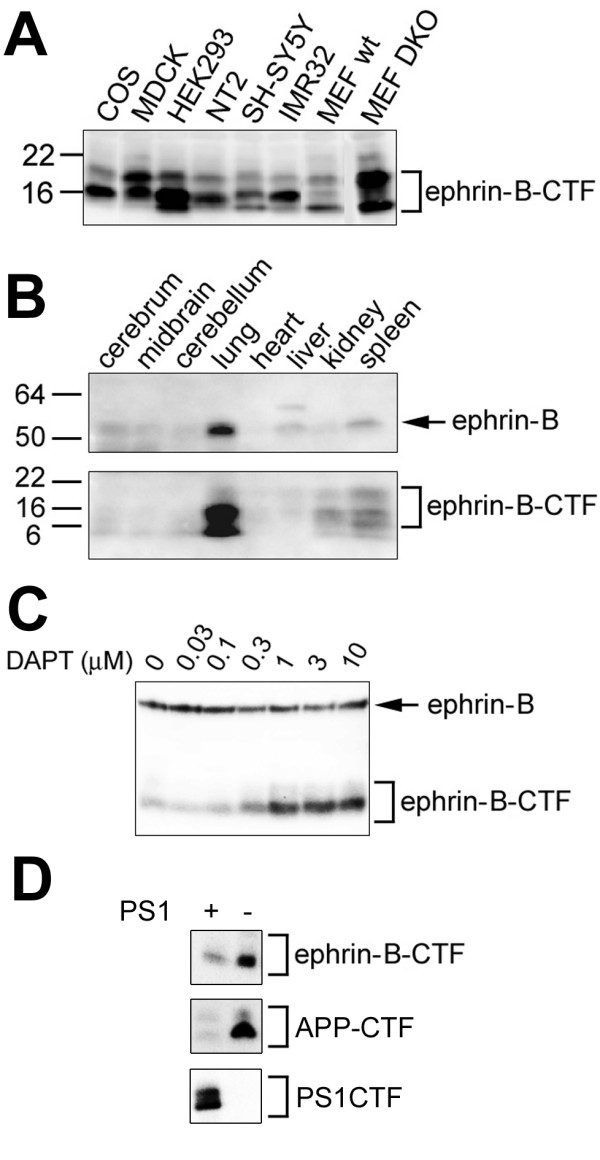
Immunoblot analysis of endogenous ephrin-B CTFs. Membrane fractions from cultured cells (A) and mouse organs (B) were subjected to immunoblot analyses using anti-ephrin-B antibody. C) Immunoblot analysis of lysates from COS cells treated with a γ-secretase inhibitor DAPT. D) Immunoblot analysis of lysates from DKO cells expressing PS1.