
Figure 2.
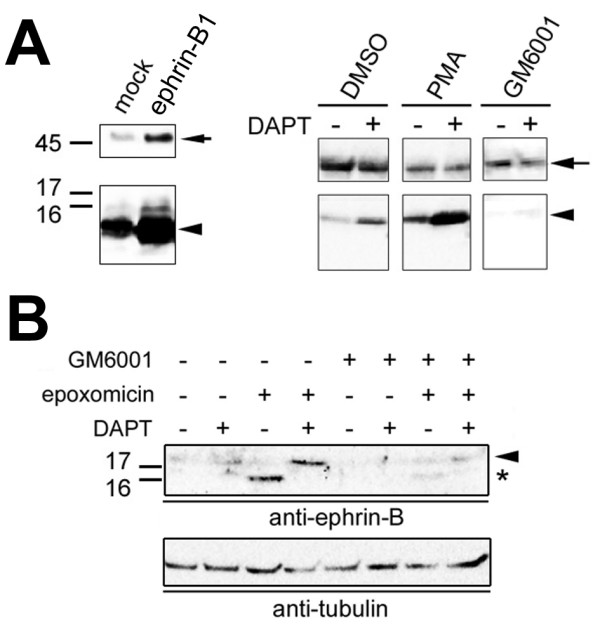
Analysis of proteolytic processing of ephrin-B1. A) Immunoblot analysis of COS cells overexpressing ephrin-B1 (arrows). ephrin-B1-CTF (arrowheads) was increased by DAPT and PMA treatment, whereas GM6001 completely diminished the ephrin-B1-CTF. B) Effect of protease inhibitors on endogenous ephrin-B CTF. Note that proteasome inhibition by epoxomicin caused an accumulation of CTF (arrowhead) and ICD (asterisk), that was abolished by GM6001 treatment.